Understanding Your Asset's Performance
The EMD Global Wind Index is built upon ERA5(T) global data, which is available for a 0.25 x 0.25 degree rectangular grid, with wind speeds at 100 meters above ground level.
Reference Index Period
Depending on the type of index calculation selected, (Region, Location or Turbine) an hourly production time-series is generated. This spans from the year 2000 up to the present and it is updated with a 7-day delay at the beginning of every month. This hourly production is then aggregated to monthly production values, and every single month its indexed relative to the pre-determined long-term representative period covering fifteen full years, starting January 2004 and ending December 2018. This 15-year average is thus the period for the reference index (100), which all individual months refer to in order to obtain the monthly wind energy index value.
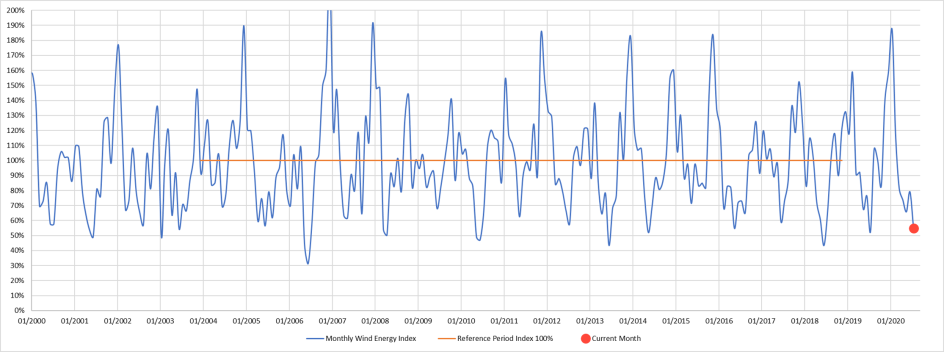
Current Month Index
The Current Month Index represents the energy available for the given month, relative to the reference period January 2004 until December 2018 (See the Reference Index Period).
The Reference Index Period is the 100% normalised long-term representative energy for the Region, Location, or turbine specific position, as selected.
Example: if the Current Month Index is 65% it means the wind energy for this month was 65% of the long-term period’s energy. If you want to normalise this month’s production to be long-term representative, you need to increase the kWh produced for this month by a factor of (1/0.65).
Last Quarter Index
This index uses the same reference period as the Current Month Index, but it covers the latest available quarterly period, e.g. January to March is Quarter 1 and so forth.
Example: The index for second quarter of 2020 (i.e. April-June) is 112%. That means the period has 12% more energy relative to the reference period January 2004 until December 2018 (See the Reference index period).
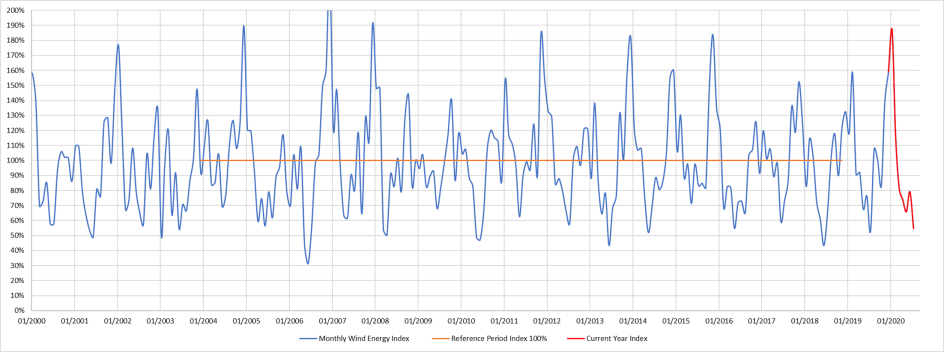
Current Year Index
The Current Year Index uses the same reference period as the Current Month Index. The difference is that the Current Year Index is an annual dynamic wind energy index which always starts from the January of the current year and covers all available months based on the time of the year.
Example: The Yearly Month Index for January 2020 to August 2020 is 86%. This means this period had 14% less energy relative to the reference period January 2004 until December 2018 (See the Reference Index Period).
Last 12-month Index
This index is the past 12 months of available indices as a ratio to the Reference Index Period.
Example: In early September 2020, the Last 12-month Index covers September 2019 until August 2020. The index for this 12-month period was 103%. That means the wind energy was 3% higher relative to the reference period January 2004 until December 2018 (See the Reference index period).
Month Abnormality Index
The Month Abnormality Index is slightly different from the four other indices mentioned above, which compares the energy of a period with the energy of an entire 15-year reference period.
The Month Abnormality Index for January 2020 is calculated relatively to the average of the fifteen observed January productions, from 2004 until 2018.
Every future month is indexed relative to the same monthly reference wind index. This tells us how any given month differs relative to the mean of that month’s reference Monthly Index.
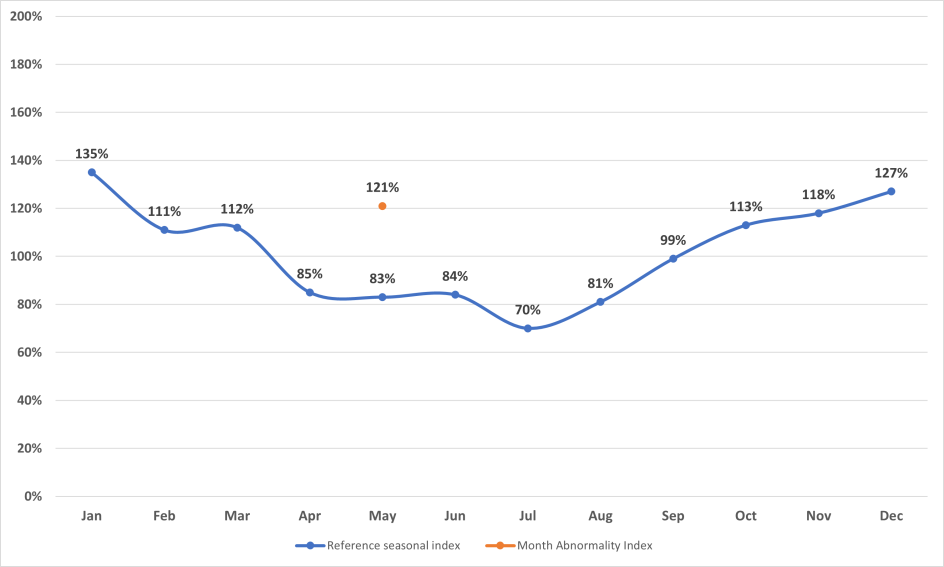
Multiple sites around the world typically have a high and a low wind season. Some companies use this knowledge to create their expected budgets for the revenue of the wind farms. The Month Abnormality Index supports this by generating a wind index which is relative to the expected energy for any given month of the year. This means the Month Abnormality Index is relative to the “Reference Seasonal Index”.
Example: The Last Month Abnormality Index for May 2020 was 121%. This indicates that May 2020 had 21% more wind energy as compared to an average May in the 2004 – 2018 period.
Below is illustrated the seasonal wind energy variation of a particular location. The blue line represents the average of all individual Januarys, Februarys, etc., relative to the 15-year Reference Index Period, to show the seasonal wind energy variation.
So, the Month Abnormality Index looks at May 2004, May 2005, May 2006, etc., and compares it to the Reference Index Period (January 2004 to December 2018). We see that all May months on average have 83% energy compared to the full Reference index period. However, May 2020 had 21% more energy than a normal May.